computational fluid dynamics · BME:5525

Pulsatile flow through a carotid bifurcation

A transient CFD study of blood flow through an image-based carotid artery in ANSYS Fluent, driven by a user-defined pulsatile inlet across a full cardiac cycle and resolved for wall shear stress. Cardiopulmonary Design & Modeling, Fall 2025.

Geometry & mesh

The carotid bifurcation is where the common carotid splits into its internal and external branches, and it is one of the most clinically interesting pieces of vasculature in the body: the geometry produces recirculation and low, oscillating wall shear stress, and those are precisely the conditions plaque forms under. Modeling it well means modeling a real one, so the study starts from an image-based STEP file rather than an idealized tube.

Two preparation steps matter before meshing. The inlet is extended by 20 mm so the velocity profile has room to develop before it reaches the bifurcation, and the surfaces are split into named selections for the inlet, both outlets, and the walls, which is what lets boundary conditions be assigned per face later.

Mesh stageSettings
Surface mesh0.15–0.4 mm, curvature size function, 20° curvature normal angle
Boundary layers10 layers, smooth-transition, 0.4 transition ratio, 1.2 growth rate, walls only
Volume meshPoly-hexcore, 3 buffer layers, 2 peel layers, 0.15–0.3 mm cells
Quality gateMinimum orthogonal quality above 0.2, improved further where needed

The ten inflation layers are the part that earns its cost. Wall shear stress is a velocity gradient evaluated at the wall, so the accuracy of the headline result depends directly on how finely the near-wall region is resolved. A curvature-driven size function does the same job around the bifurcation apex, where the geometry turns sharply.
Solver setup

ParameterValue
TimeTransient, fixed 0.01 s step, 75 steps = one 0.75 s cycle at 80 bpm
Viscous modelLaminar
FluidBlood: 1056 kg/m³, 0.0035 kg/(m·s)
InletPulsatile velocity via compiled UDF, 3.15 mm radius, peak Re 1000
OutletsBoth pressure outlets at 13,332.2 Pa (100 mmHg)
Initial pressure15,998.7 Pa (120 mmHg)
CouplingSIMPLE, residual targets 1e-6, hybrid initialization
IterationsUp to 500 per timestep

The inlet condition is the interesting part. Rather than a fixed velocity, a user-defined function computes the inlet profile from the current flow time, reconstructing a physiological waveform from its harmonics so the simulation sees a real cardiac pulse instead of a step. An area-weighted velocity monitor on the inlet surface runs alongside the solve purely to confirm the UDF is producing the waveform it should.

Thirty massless particle streams are injected at the inlet as well. They carry no momentum and do not affect the solution, but they make the recirculation visible in a way contour plots do not.

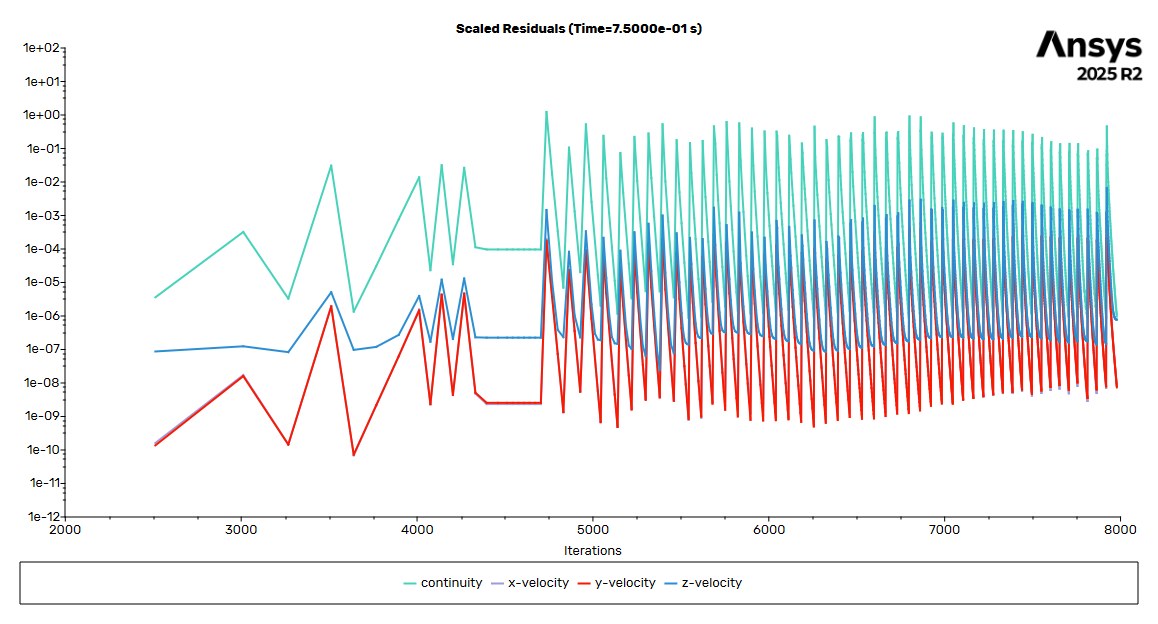
Residual plot showing continuity and velocity residuals across the solve
Residuals across the run. Each sawtooth is a new timestep converging; the change in character partway through is the pulse arriving.

Results

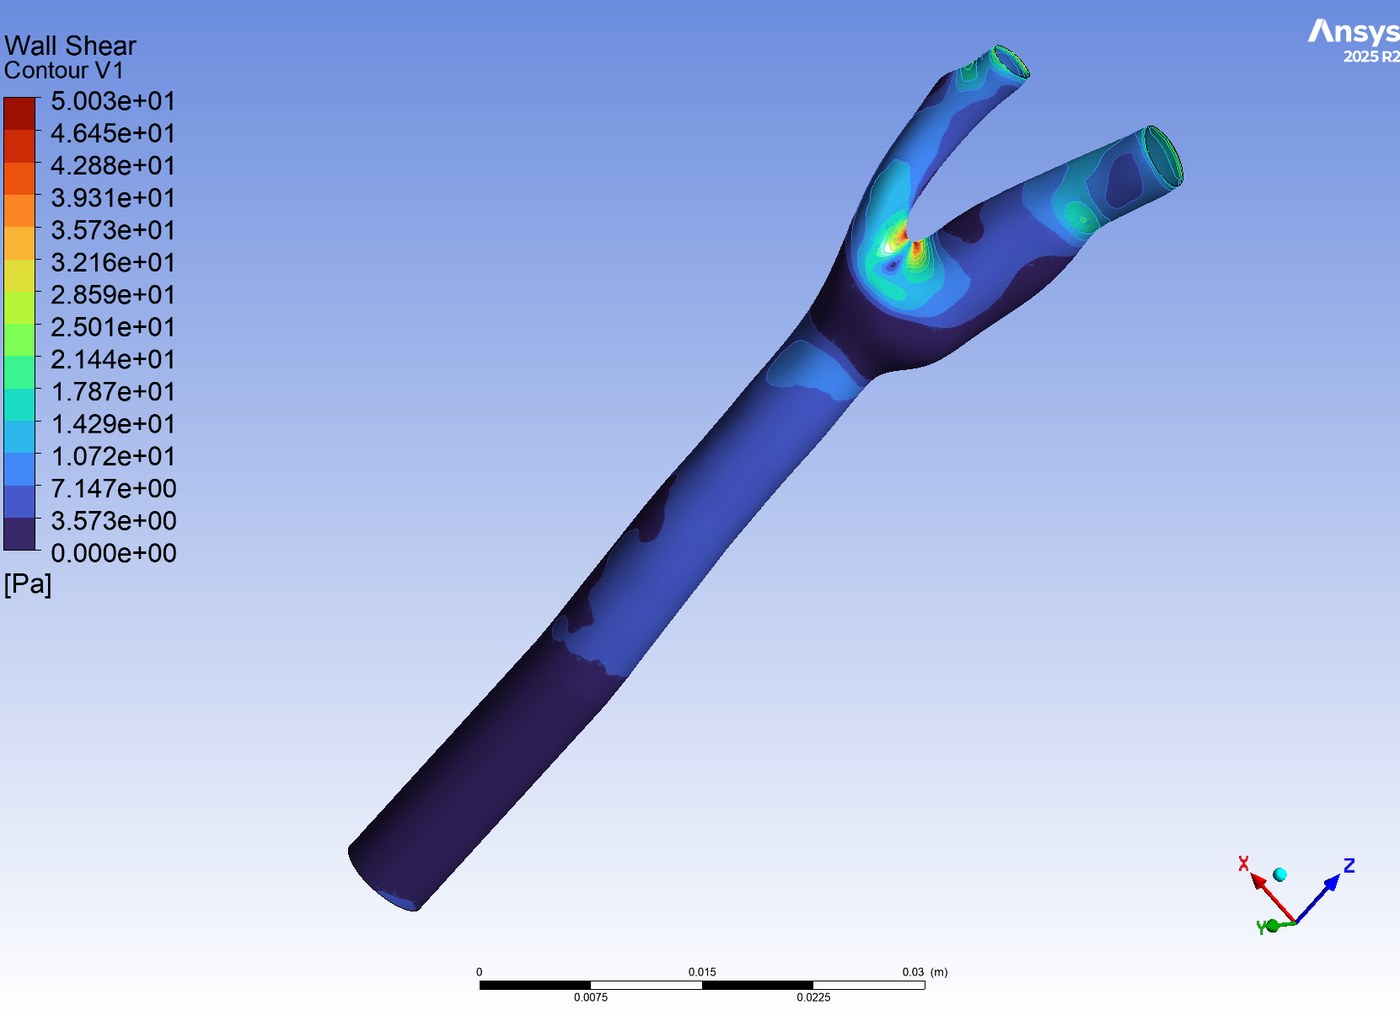
Wall shear stress and static pressure were sampled at two points in the cycle: timestep 15 (t = 0.15 s), where the inlet waveform peaks, and timestep 75 (t = 0.75 s), at the end of diastole.

Wall shear stress contour on the carotid walls at peak systole
WSS at peak systole. The maximum sits on the flow divider at the bifurcation apex, around 50 Pa.
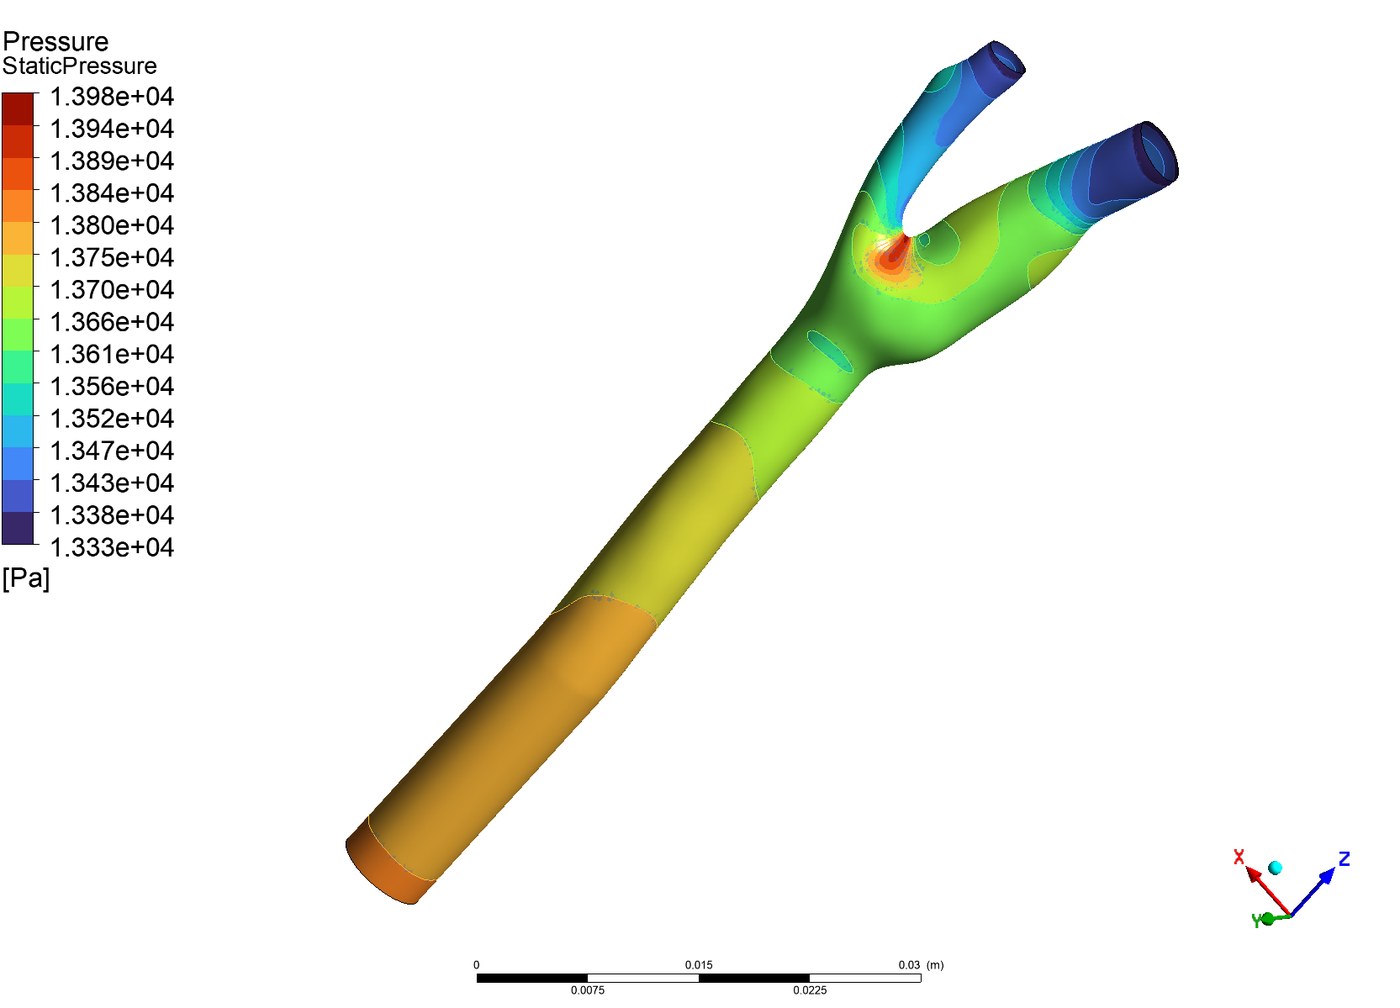
Static pressure contour on the carotid walls at peak systole
Static pressure at the same instant, showing the drop from the common carotid through the branches.
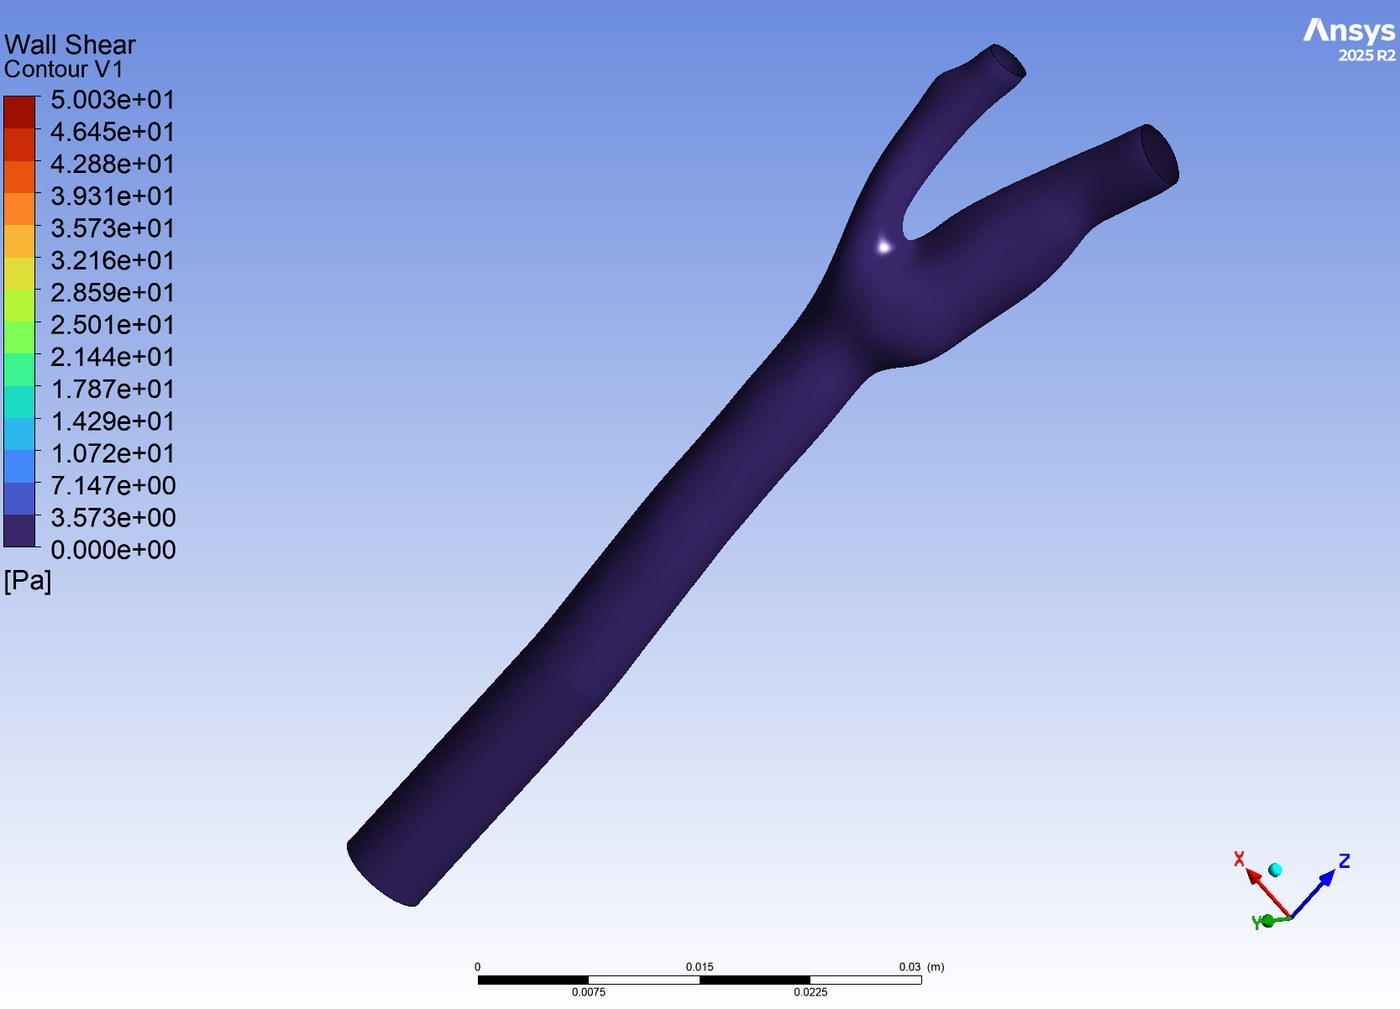
Wall shear stress contour on the carotid walls at end diastole
WSS at end diastole. Nearly uniform and close to zero across the whole vessel.
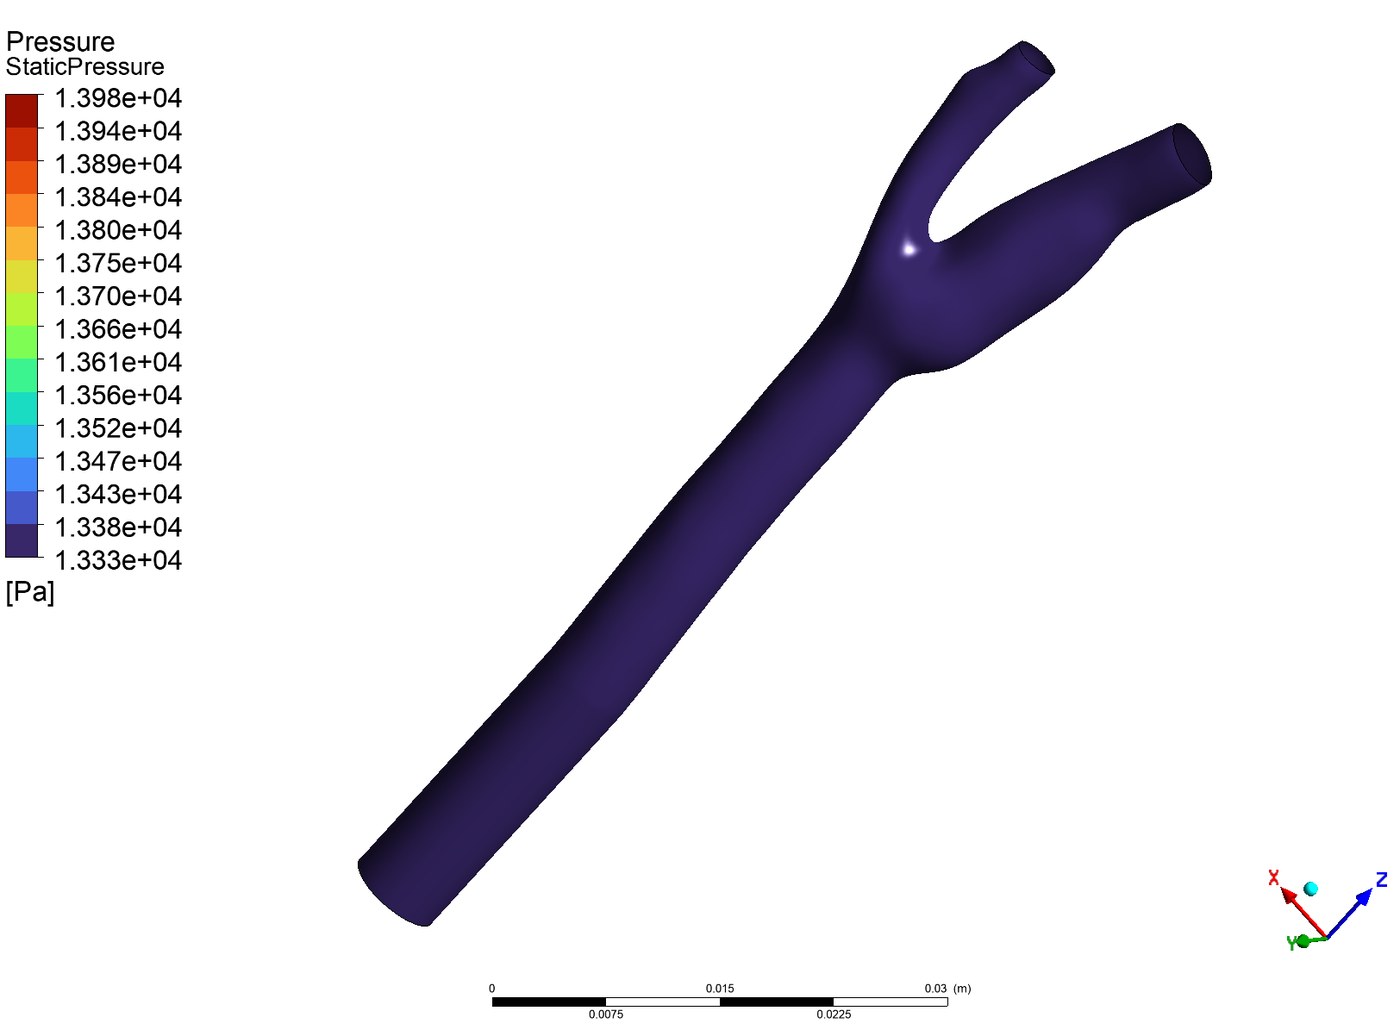
Static pressure contour on the carotid walls at end diastole
Pressure at end diastole, flattened out as flow decays.

The contrast between the two instants is the physiologically meaningful result. At peak systole the apex takes a concentrated shear load while the outer wall of the sinus, just downstream of the split, stays comparatively unloaded. By end diastole the whole field has collapsed to near zero. Those wall regions therefore see a large swing in shear magnitude and direction over a single beat, and it is that oscillation, rather than high shear on its own, that the literature associates with plaque development at this exact location. A steady-flow simulation would have shown none of it, which is the argument for paying the transient cost.

Animations

Solution data was exported every five timesteps and reassembled in CFD-Post as a single case covering the whole cycle, which is what makes these playbacks possible.

Wall shear stress across the cardiac cycle. Watch the apex load and unload.
Static pressure over the same cycle.
Velocity vectors through the fluid domain, with the walls set transparent.
A plane swept through the domain at peak systole, sectioning the velocity field end to end.

The sweep is the one worth watching twice. Holding time fixed at peak systole and moving a cutting plane along the vessel shows how the profile deforms as it passes the bifurcation, skewing toward the flow divider and leaving a slow region against the outer wall.

Keywords

CFD ANSYS Fluent hemodynamics wall shear stress transient analysis mesh generation user-defined functions

Results deck

Residuals, contour plots at both timesteps, and all four animations.

Download PPTX